Note
Go to the end to download the full example code
Resampling data#
Sometimes you may want to resample your data to a different sampling rate.
We provide a utility class to do this.
It wraps scipy.signal.resample and provides a standardized transform interface, so that it can be chained
and used with other transforms in mobgap.
Below we show how to apply the method.
import matplotlib.pyplot as plt
from mobgap.data import LabExampleDataset
from mobgap.data_transform import Resample
Loading some example data#
example_data = LabExampleDataset()
ha_example_data = example_data.get_subset(cohort="HA")
single_test = ha_example_data.get_subset(
    participant_id="002", test="Test5", trial="Trial2"
)
data = single_test.data_ss

data.head()
Applying the resampling transform#
For this we need to create an instance of the Resample class with our target sampling rate.
Then we can perform the resampling operation by calling the transform method
resampled = resampler.transform(
    data, sampling_rate_hz=single_test.sampling_rate_hz
)
The results can be accessed via the transformed_data_ attribute. Here we only extract the gyro data.
resampled_gyr = resampled.transformed_data_.filter(like="gyr")
resampled_gyr.head()
Note, that the resampled data still has a datetime index.
This is, because the resampling operation attempts to resample the index as well, if the index is numeric or datetime.
If you want to disable this behavior, you can set the attempt_index_resample parameter to False.
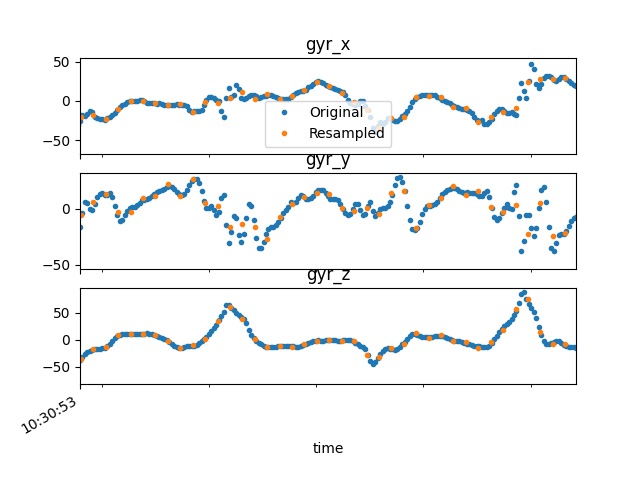
We will plot the resampled data together with the original data. As expected, the resampled data has much fewer samples (as we downsampled from 100 Hz to 20 Hz). However, you could use the same method to upsample your data.
fig, axs = plt.subplots(3, 1, sharex=True)
for ax, col in zip(axs, resampled_gyr.columns):
    ax.set_title(col)
    data[col].plot(ax=ax, label="Original", style=".")
    resampled_gyr[col].plot(ax=ax, label="Resampled", style=".")

axs[0].set_xlim(data.index[300], data.index[500])
axs[0].legend()
fig.show()
Total running time of the script: (0 minutes 1.336 seconds)
Estimated memory usage: 9 MB