
Note
Go to the end to download the full example code.
Performance of the reorientation algorithm on simulated TVS misorientations#
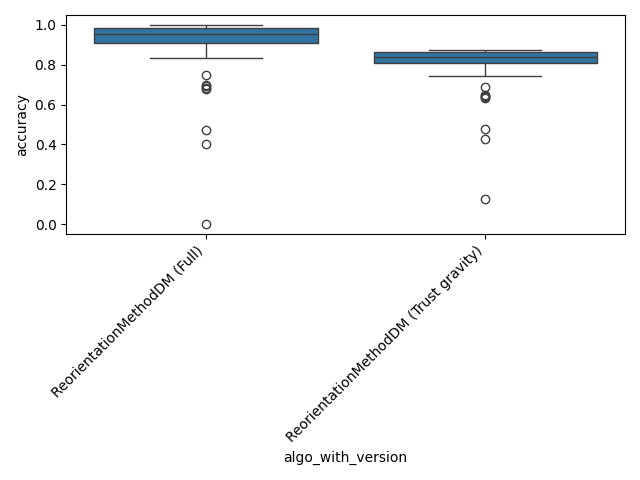
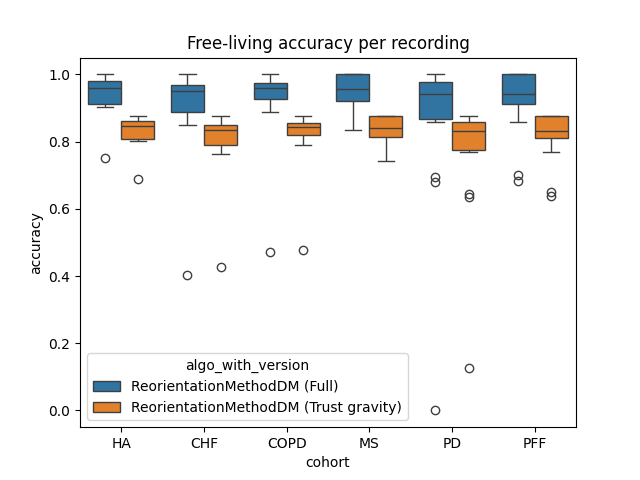
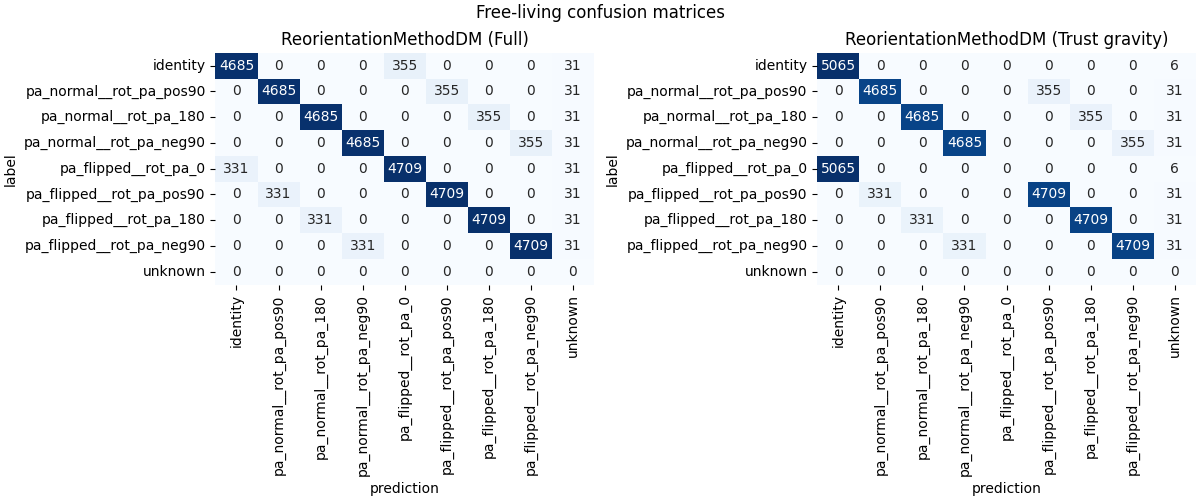
The TVS dataset does not provide recordings with known lower-back sensor misorientations. For this revalidation, we therefore use the INDIP reference walking bouts, simulate all supported rough mounting orientations, and treat the algorithm response as a multiclass classification problem.
We compare the full and trust-gravity variants of the
ReorientationMethodDM algorithm.
Note
If you are interested in how these results are calculated, head over to the processing page.
Algorithms#
The result generation script stores one result folder per algorithm variant. Here, we map these folder names to display labels used in plots and tables.
algorithms = {
    "MethodDM__full": ("ReorientationMethodDM", "Full"),
    "MethodDM__trust_gravity": ("ReorientationMethodDM", "Trust gravity"),
}
Loading Results#
By default, the data will be downloaded from the validation result repository.
During development, set MOBGAP_VALIDATION_USE_LOCAL_DATA=1 and point
MOBGAP_VALIDATION_DATA_PATH to the local validation-data folder.
from pathlib import Path

import matplotlib.pyplot as plt
import numpy as np
import pandas as pd
import seaborn as sns
from mobgap.data.validation_results import ValidationResultLoader
from mobgap.re_orientation.pipeline import REORIENTATION_LABELS
from mobgap.utils.misc import get_env_var

IDENTITY_LABEL = "identity"
UNCORRECTABLE_TRUST_GRAVITY_LABEL = "pa_flipped__rot_pa_0"
FULL_VERSION = "Full"
TRUST_GRAVITY_VERSION = "Trust gravity"


def format_loaded_results(
    values: dict[tuple[str, str], pd.DataFrame],
    index_cols: list[str],
) -> pd.DataFrame:
    formatted = (
        pd.concat(values, names=["algo", "version", *index_cols])
        .reset_index()
        .assign(
            algo_with_version=lambda df: (
                df["algo"] + " (" + df["version"] + ")"
            ),
            _combined="combined",
        )
    )
    return formatted


def load_raw_predictions(
    loader: ValidationResultLoader,
    algo_name: str,
    condition: str,
) -> pd.DataFrame:
    return loader.load_single_csv_file(
        algo_name, condition, "raw_predictions.csv"
    ).reset_index()


def format_loaded_predictions(
    values: dict[tuple[str, str], pd.DataFrame],
) -> pd.DataFrame:
    formatted_predictions = []
    for (algo, version), df in values.items():
        formatted_predictions.append(
            df.assign(
                algo=algo,
                version=version,
                algo_with_version=f"{algo} ({version})",
                is_correct=lambda data: data["label"] == data["prediction"],
            )
        )

    return pd.concat(
        formatted_predictions,
        ignore_index=True,
    )


local_data_path = (
    Path(get_env_var("MOBGAP_VALIDATION_DATA_PATH")) / "results"
    if int(get_env_var("MOBGAP_VALIDATION_USE_LOCAL_DATA", 0))
    else None
)
__RESULT_VERSION = "main"
loader = ValidationResultLoader(
    "re_orientation", result_path=local_data_path, version=__RESULT_VERSION
)

free_living_index_cols = [
    "cohort",
    "participant_id",
    "time_measure",
    "recording",
    "recording_name",
    "recording_name_pretty",
]

free_living_results = format_loaded_results(
    {
        v: loader.load_single_results(k, "free_living")
        for k, v in algorithms.items()
    },
    free_living_index_cols,
)
free_living_predictions = format_loaded_predictions(
    {
        v: load_raw_predictions(loader, k, "free_living")
        for k, v in algorithms.items()
    }
)

lab_index_cols = [
    "cohort",
    "participant_id",
    "time_measure",
    "test",
    "trial",
    "test_name",
    "test_name_pretty",
]

lab_results = format_loaded_results(
    {
        v: loader.load_single_results(k, "laboratory")
        for k, v in algorithms.items()
    },
    lab_index_cols,
)
lab_predictions = format_loaded_predictions(
    {
        v: load_raw_predictions(loader, k, "laboratory")
        for k, v in algorithms.items()
    }
)
combined_predictions = pd.concat(
    [free_living_predictions, lab_predictions], ignore_index=True
)

cohort_order = ["HA", "CHF", "COPD", "MS", "PD", "PFF"]
  0%|                                              | 0.00/1.02k [00:00<?, ?B/s]
  0%|                                              | 0.00/1.02k [00:00<?, ?B/s]
100%|█████████████████████████████████████| 1.02k/1.02k [00:00<00:00, 5.89MB/s]

  0%|                                              | 0.00/1.02k [00:00<?, ?B/s]
  0%|                                              | 0.00/1.02k [00:00<?, ?B/s]
100%|█████████████████████████████████████| 1.02k/1.02k [00:00<00:00, 6.87MB/s]

  0%|                                               | 0.00/136k [00:00<?, ?B/s]
  0%|                                               | 0.00/136k [00:00<?, ?B/s]
100%|████████████████████████████████████████| 136k/136k [00:00<00:00, 484MB/s]

  0%|                                               | 0.00/135k [00:00<?, ?B/s]
  0%|                                               | 0.00/135k [00:00<?, ?B/s]
100%|████████████████████████████████████████| 135k/135k [00:00<00:00, 473MB/s]

  0%|                                              | 0.00/4.73k [00:00<?, ?B/s]
  0%|                                              | 0.00/4.73k [00:00<?, ?B/s]
100%|█████████████████████████████████████| 4.73k/4.73k [00:00<00:00, 28.4MB/s]

  0%|                                              | 0.00/4.70k [00:00<?, ?B/s]
  0%|                                              | 0.00/4.70k [00:00<?, ?B/s]
100%|█████████████████████████████████████| 4.70k/4.70k [00:00<00:00, 26.2MB/s]

  0%|                                              | 0.00/41.6k [00:00<?, ?B/s]
  0%|                                              | 0.00/41.6k [00:00<?, ?B/s]
100%|██████████████████████████████████████| 41.6k/41.6k [00:00<00:00, 164MB/s]

  0%|                                              | 0.00/41.1k [00:00<?, ?B/s]
  0%|                                              | 0.00/41.1k [00:00<?, ?B/s]
100%|██████████████████████████████████████| 41.1k/41.1k [00:00<00:00, 172MB/s]
Performance Metrics#
We report two accuracy views:
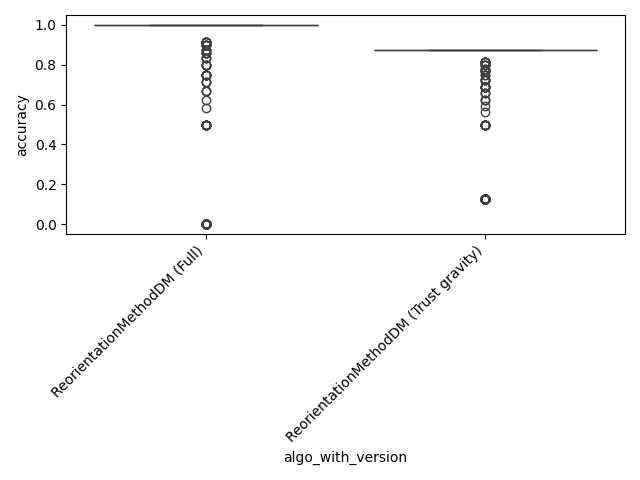
The average per-recording accuracy. Every datapoint contributes one value.
The combined accuracy over every simulated walking-bout orientation row.
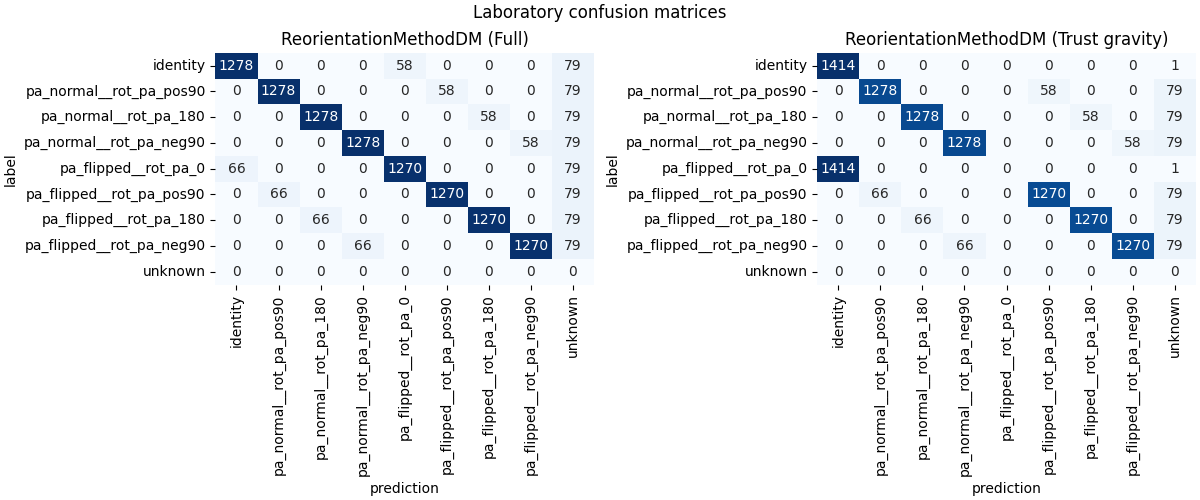
The confusion matrices use the combined predictions.
from functools import partial

from mobgap.pipeline.evaluation import CustomErrorAggregations as A
from mobgap.utils.df_operations import (
    CustomOperation,
    apply_aggregations,
    apply_transformations,
)
from mobgap.utils.tables import FormatTransformer as F
from mobgap.utils.tables import RevalidationInfo, revalidation_table_styles

custom_aggs = [
    CustomOperation(
        identifier=None,
        function=A.n_datapoints,
        column_name=[("n_datapoints", "all")],
    ),
    ("accuracy", ["mean", A.conf_intervals]),
]

format_transforms = [
    CustomOperation(
        identifier=None,
        function=lambda df_: df_[("n_datapoints", "all")].astype(int),
        column_name="n_datapoints",
    ),
    CustomOperation(
        identifier=None,
        function=partial(
            F.value_with_metadata,
            value_col=("mean", "accuracy"),
            other_columns={"range": ("conf_intervals", "accuracy")},
        ),
        column_name="accuracy",
    ),
]


def validation_thresholds(datapoint_label: str) -> dict[str, RevalidationInfo]:
    return {
        f"Accuracy per {datapoint_label}": RevalidationInfo(
            threshold=0.8, higher_is_better=True
        ),
        "Combined accuracy": RevalidationInfo(
            threshold=0.8, higher_is_better=True
        ),
    }


def calculate_combined_accuracy(
    predictions: pd.DataFrame,
    groupby: list[str],
) -> pd.Series:
    return (
        predictions.groupby(groupby)["is_correct"]
        .mean()
        .rename("combined_accuracy")
    )


def format_tables(
    single_results: pd.DataFrame,
    raw_predictions: pd.DataFrame,
    groupby: list[str],
    datapoint_label: str,
) -> pd.DataFrame:
    final_names = {
        "n_datapoints": f"# {datapoint_label}s",
        "accuracy": f"Accuracy per {datapoint_label}",
        "combined_accuracy": "Combined accuracy",
    }
    formatted_single_results = (
        single_results.groupby(groupby)
        .apply(apply_aggregations, custom_aggs, include_groups=False)
        .pipe(apply_transformations, format_transforms)
        .rename(columns=final_names)
        .loc[:, [final_names["n_datapoints"], final_names["accuracy"]]]
    )
    combined_accuracy = calculate_combined_accuracy(raw_predictions, groupby)
    formatted_single_results["Combined accuracy"] = combined_accuracy
    return formatted_single_results.loc[:, list(final_names.values())]


def calculate_confusion_matrix(predictions: pd.DataFrame) -> pd.DataFrame:
    known_labels = list(REORIENTATION_LABELS)
    extra_labels = sorted(
        set(predictions["label"]).union(predictions["prediction"])
        - set(known_labels)
    )
    labels = [*known_labels, *extra_labels]
    matrix = pd.crosstab(predictions["label"], predictions["prediction"])
    return matrix.reindex(index=labels, columns=labels, fill_value=0)


def calculate_label_accuracies(
    predictions: pd.DataFrame,
    groupby: list[str],
) -> pd.DataFrame:
    return predictions.pivot_table(
        index=groupby,
        columns="label",
        values="is_correct",
        aggfunc="mean",
    ).reindex(columns=REORIENTATION_LABELS)


def orientation_prevalence_weights(
    total_misorientation_prevalence: float,
) -> pd.Series:
    weights = pd.Series(
        total_misorientation_prevalence / (len(REORIENTATION_LABELS) - 1),
        index=REORIENTATION_LABELS,
    )
    weights[IDENTITY_LABEL] = 1 - total_misorientation_prevalence
    return weights


def calculate_weighted_accuracy_by_prevalence(
    predictions: pd.DataFrame,
    prevalence_scenarios: pd.Series,
) -> pd.DataFrame:
    label_accuracies = calculate_label_accuracies(
        predictions, ["algo", "version"]
    )
    return pd.DataFrame(
        {
            scenario: label_accuracies.mul(
                orientation_prevalence_weights(prevalence),
                axis=1,
            ).sum(axis=1)
            for scenario, prevalence in prevalence_scenarios.items()
        }
    )


def calculate_weighted_accuracy_curve(
    predictions: pd.DataFrame,
    prevalence_grid: np.ndarray,
) -> pd.DataFrame:
    label_accuracies = calculate_label_accuracies(predictions, ["version"])
    rows = []
    for version, accuracies in label_accuracies.iterrows():
        for prevalence in prevalence_grid:
            rows.append(
                {
                    "version": version,
                    "total_misorientation_prevalence": prevalence,
                    "weighted_accuracy": accuracies.mul(
                        orientation_prevalence_weights(prevalence)
                    ).sum(),
                }
            )
    return pd.DataFrame(rows)


def _break_even_prevalence(identity_diff: float, error_diff: float) -> float:
    denominator = error_diff - identity_diff
    if np.isclose(denominator, 0):
        return np.nan

    break_even = -identity_diff / denominator
    if 0 <= break_even <= 1:
        return break_even
    return np.nan


def calculate_mode_break_even_points(predictions: pd.DataFrame) -> pd.Series:
    label_accuracies = calculate_label_accuracies(predictions, ["version"])
    diff = (
        label_accuracies.loc[TRUST_GRAVITY_VERSION]
        - label_accuracies.loc[FULL_VERSION]
    )

    return pd.Series(
        {
            "Total error prevalence": _break_even_prevalence(
                diff[IDENTITY_LABEL],
                diff.drop(index=IDENTITY_LABEL).mean(),
            ),
            "Specific PA-flip prevalence": _break_even_prevalence(
                diff[IDENTITY_LABEL],
                diff[UNCORRECTABLE_TRUST_GRAVITY_LABEL],
            ),
        }
    )


def calculate_mode_break_even_inputs(predictions: pd.DataFrame) -> pd.DataFrame:
    label_accuracies = calculate_label_accuracies(predictions, ["version"])
    non_identity_labels = [
        label for label in REORIENTATION_LABELS if label != IDENTITY_LABEL
    ]
    input_labels = {
        "Identity orientation": IDENTITY_LABEL,
        "Mean non-identity orientation": non_identity_labels,
        "Uncorrectable PA-flip orientation": (
            UNCORRECTABLE_TRUST_GRAVITY_LABEL
        ),
    }

    rows = []
    for name, label_or_labels in input_labels.items():
        labels = (
            [label_or_labels]
            if isinstance(label_or_labels, str)
            else label_or_labels
        )
        full_accuracy = label_accuracies.loc[FULL_VERSION, labels].mean()
        trust_gravity_accuracy = label_accuracies.loc[
            TRUST_GRAVITY_VERSION, labels
        ].mean()
        rows.append(
            {
                "Input": name,
                "Full accuracy": full_accuracy,
                "Trust gravity accuracy": trust_gravity_accuracy,
                "Trust gravity - full": (
                    trust_gravity_accuracy - full_accuracy
                ),
            }
        )
    return pd.DataFrame(rows).set_index("Input")
Free-Living Comparison#
The free-living condition is the expected use case for unknown sensor mounting orientations.
fig, ax = plt.subplots()
sns.boxplot(
    data=free_living_results,
    x="algo_with_version",
    y="accuracy",
    ax=ax,
)
plt.xticks(rotation=45, ha="right")
fig.tight_layout()
fig.show()

free_living_perf_metrics_all = format_tables(
    free_living_results,
    free_living_predictions,
    ["algo", "version"],
    "recording",
)
free_living_perf_metrics_all.style.pipe(
    revalidation_table_styles, validation_thresholds("recording"), ["algo"]
)
Per Cohort#
fig, ax = plt.subplots()
sns.boxplot(
    data=free_living_results,
    x="cohort",
    y="accuracy",
    hue="algo_with_version",
    order=cohort_order,
    ax=ax,
)
ax.set_title("Free-living accuracy per recording")
fig.show()

free_living_perf_metrics_cohort = format_tables(
    free_living_results,
    free_living_predictions,
    ["cohort", "algo", "version"],
    "recording",
).loc[cohort_order]
free_living_perf_metrics_cohort.style.pipe(
    revalidation_table_styles,
    validation_thresholds("recording"),
    ["cohort", "algo"],
)
Confusion Matrices#
fig, axes = plt.subplots(
    1,
    len(algorithms),
    figsize=(6 * len(algorithms), 5),
    constrained_layout=True,
)
if len(algorithms) == 1:
    axes = [axes]

for ax, ((algo, version), data) in zip(
    axes, free_living_predictions.groupby(["algo", "version"], sort=False)
):
    sns.heatmap(
        calculate_confusion_matrix(data),
        annot=True,
        fmt="d",
        cmap="Blues",
        cbar=False,
        ax=ax,
    )
    ax.set_title(f"{algo} ({version})")

fig.suptitle("Free-living confusion matrices")
fig.show()
Laboratory Comparison#
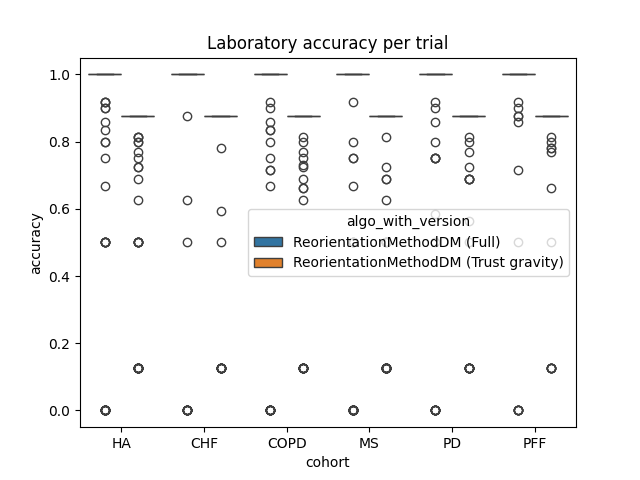
Every datapoint below is one lab trial. The simulated orientation rows are created within every reference walking bout of that trial.
fig, ax = plt.subplots()
sns.boxplot(data=lab_results, x="algo_with_version", y="accuracy", ax=ax)
plt.xticks(rotation=45, ha="right")
fig.tight_layout()
fig.show()

lab_perf_metrics_all = format_tables(
    lab_results, lab_predictions, ["algo", "version"], "trial"
)
lab_perf_metrics_all.style.pipe(
    revalidation_table_styles, validation_thresholds("trial"), ["algo"]
)
Per Cohort#
fig, ax = plt.subplots()
sns.boxplot(
    data=lab_results,
    x="cohort",
    y="accuracy",
    hue="algo_with_version",
    order=cohort_order,
    ax=ax,
)
ax.set_title("Laboratory accuracy per trial")
fig.show()

lab_perf_metrics_cohort = format_tables(
    lab_results,
    lab_predictions,
    ["cohort", "algo", "version"],
    "trial",
).loc[cohort_order]
lab_perf_metrics_cohort.style.pipe(
    revalidation_table_styles,
    validation_thresholds("trial"),
    ["cohort", "algo"],
)
Confusion Matrices#
fig, axes = plt.subplots(
    1,
    len(algorithms),
    figsize=(6 * len(algorithms), 5),
    constrained_layout=True,
)
if len(algorithms) == 1:
    axes = [axes]

for ax, ((algo, version), data) in zip(
    axes, lab_predictions.groupby(["algo", "version"], sort=False)
):
    sns.heatmap(
        calculate_confusion_matrix(data),
        annot=True,
        fmt="d",
        cmap="Blues",
        cbar=False,
        ax=ax,
    )
    ax.set_title(f"{algo} ({version})")

fig.suptitle("Laboratory confusion matrices")
fig.show()
Prevalence-weighted mode choice#
The simulated validation data contains all supported orientation labels with equal weight. This is useful to stress-test every class, but it is not the expected real-world prevalence. In practice, most walking bouts should already be correctly oriented. We therefore also calculate weighted accuracies for explicit prevalence scenarios.
5% total errors: 95% identity orientation and 5% errors split equally across the seven non-identity orientation classes.Equal simulated classes: the class-balanced simulation view. This corresponds to 12.5% identity and 87.5% total orientation errors.
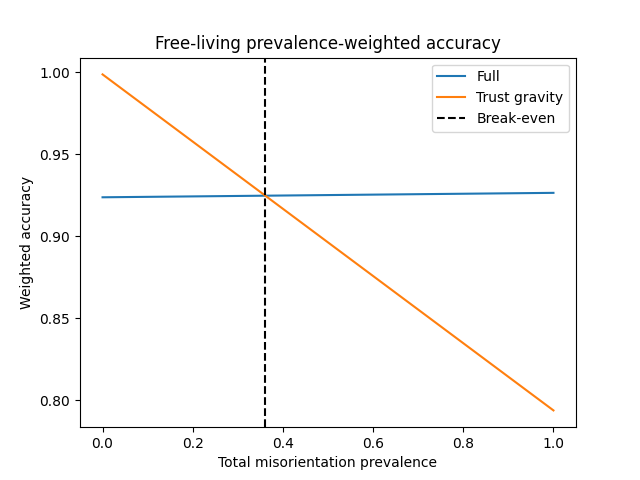
The break-even calculation uses the accuracy difference
trust_gravity - full. trust_gravity usually wins on the identity
class, because it does not try to correct a front-back flip when gravity is
already plausible. full wins on the one front-back flip class that
trust_gravity intentionally leaves unresolved. The relevant question is
therefore how common these true orientation errors are compared to correctly
mounted walking bouts.
We calculate the break-even point by solving:
for p:
The reported thresholds use two choices for \(\Delta_\mathrm{error}\):
Total error prevalence: identity has prevalence1 - pand all seven non-identity classes have prevalencep / 7. Here, \(\Delta_\mathrm{error}\) is the mean difference across all non-identity labels.Uncorrectable PA-flip prevalence: only the correctly mounted identity orientation andpa_flipped__rot_pa_0vary. This isolates the same-gravity, front-back flip case thattrust_gravityintentionally cannot distinguish from identity.
The Combined TVS rows pool the free-living and laboratory prediction rows
to provide a single rough TVS-level threshold. Use the condition-specific rows
if your target setting maps clearly to one of the two validation conditions.
prevalence_scenarios = pd.Series(
    {
        "5% total errors": 0.05,
        "33% total errors": 0.33,
        "Equal simulated classes": 1 - 1 / len(REORIENTATION_LABELS),
    }
)

weighted_accuracy_scenarios = pd.concat(
    {
        "Combined TVS": calculate_weighted_accuracy_by_prevalence(
            combined_predictions, prevalence_scenarios
        ),
        "Free-living": calculate_weighted_accuracy_by_prevalence(
            free_living_predictions, prevalence_scenarios
        ),
        "Laboratory": calculate_weighted_accuracy_by_prevalence(
            lab_predictions, prevalence_scenarios
        ),
    },
    names=["condition"],
)
weighted_accuracy_scenarios.style.format("{:.1%}")
break_even_inputs = pd.concat(
    {
        "Combined TVS": calculate_mode_break_even_inputs(combined_predictions),
        "Free-living": calculate_mode_break_even_inputs(
            free_living_predictions
        ),
        "Laboratory": calculate_mode_break_even_inputs(lab_predictions),
    },
    names=["condition", "input"],
)
break_even_inputs.style.format("{:.1%}")
break_even_points = pd.DataFrame(
    {
        "Combined TVS": calculate_mode_break_even_points(combined_predictions),
        "Free-living": calculate_mode_break_even_points(
            free_living_predictions
        ),
        "Laboratory": calculate_mode_break_even_points(lab_predictions),
    }
).T
break_even_points = break_even_points.rename(
    columns={
        "Total error prevalence": "Total error prevalence p",
        "Specific PA-flip prevalence": "Uncorrectable PA-flip prevalence q",
    }
)
break_even_points.style.format("{:.1%}", na_rep="outside [0, 100%]")
The free-living curve shows why the preferred mode depends on the expected prevalence of orientation errors.
prevalence_grid = np.linspace(0, 1, 101)
free_living_weighted_accuracy_curve = calculate_weighted_accuracy_curve(
    free_living_predictions,
    prevalence_grid,
)

fig, ax = plt.subplots()
sns.lineplot(
    data=free_living_weighted_accuracy_curve,
    x="total_misorientation_prevalence",
    y="weighted_accuracy",
    hue="version",
    ax=ax,
)
free_living_break_even = break_even_points.loc[
    "Free-living", "Total error prevalence p"
]
if not np.isnan(free_living_break_even):
    ax.axvline(
        free_living_break_even,
        color="black",
        linestyle="--",
        label="Break-even",
    )
ax.set(
    xlabel="Total misorientation prevalence",
    ylabel="Weighted accuracy",
    title="Free-living prevalence-weighted accuracy",
)
ax.legend()
fig.show()
Total running time of the script: (0 minutes 10.032 seconds)
Estimated memory usage: 83 MB