Note
Go to the end to download the full example code.
Additional Full Pipeline Experiments#
The following analysis tries to awnser the question how much specific components of the pipeline contribute to the improvements that we see in the new implementation of the full pipeline.
Note
If you are interested in how these results are calculated, head over to the processing page.
from typing import Optional
Below the list of pipelines that are compared is shown. Note, that we use the prefix “new” to refer to the reimplemented python algorithms, and the prefix “old” to refer to the original Matlab-based implementation.
algorithms = {
    "Official_MobiliseD_Pipeline": ("Mobilise-D Pipeline", "MobGap"),
    "EScience_MobiliseD_Pipeline": (
        "Mobilise-D Pipeline",
        "Original Implementation",
    ),
    "Official_MobiliseD_Pipeline__old_gs": (
        "Mobilise-D Pipeline",
        "MobGap (with old GS)",
    ),
    "Official_MobiliseD_Pipeline__old_lrc": (
        "Mobilise-D Pipeline",
        "MobGap (with old LRC)",
    ),
}
The code below loads the data and prepares it for the analysis.
By default, the data will be downloaded from an online repository (and cached locally).
If you want to use a local copy of the data, you can set the MOBGAP_VALIDATION_DATA_PATH environment variable.
and the MOBGAP_VALIDATION_USE_LOCA_DATA to 1.
The file download will print a couple log information, which can usually be ignored.
You can also change the version parameter to load a different version of the data.
from pathlib import Path

import pandas as pd
from mobgap.data.validation_results import ValidationResultLoader
from mobgap.utils.misc import get_env_var


def format_loaded_results(
    values: dict[tuple[str, str], pd.DataFrame],
    index_cols: list[str],
    col_prefix_filter: Optional[str],
    convert_rel_error: bool = False,
) -> pd.DataFrame:
    formatted = (
        pd.concat(values, names=["algo", "version", *index_cols])
        .pipe(
            lambda df: (
                df.filter(like=col_prefix_filter) if col_prefix_filter else df
            )
        )
        .reset_index()
        .assign(
            algo_with_version=lambda df: (
                df["algo"] + " (" + df["version"] + ")"
            ),
            _combined="combined",
        )
    )

    if col_prefix_filter:
        formatted.columns = formatted.columns.str.removeprefix(
            col_prefix_filter
        )

    if convert_rel_error:
        rel_cols = [c for c in formatted.columns if "rel_error" in c]
        formatted[rel_cols] = formatted[rel_cols] * 100

    return formatted


local_data_path = (
    Path(get_env_var("MOBGAP_VALIDATION_DATA_PATH")) / "results"
    if int(get_env_var("MOBGAP_VALIDATION_USE_LOCAL_DATA", 0))
    else None
)
__RESULT_VERSION = "v1.0.0"
loader = ValidationResultLoader(
    "full_pipeline",
    result_path=local_data_path,
    version="main",
)

# Loading free-living data
free_living_index_cols = [
    "cohort",
    "participant_id",
    "time_measure",
    "recording",
    "recording_name",
    "recording_name_pretty",
]

_free_living_results = {  # Matched and aggregate/combined per-recording results for the 2.5 h free-living recordings
    v: loader.load_single_results(k, "free_living")
    for k, v in algorithms.items()
}

_free_living_results_raw = {  # Matched per-WB results for the 2.5 h free-living recordings
    v: loader.load_single_csv_file(k, "free_living", "raw_matched_errors.csv")
    for k, v in algorithms.items()
}
free_living_results_combined = format_loaded_results(
    _free_living_results,
    free_living_index_cols,
    "combined__",
    convert_rel_error=True,
)
free_living_results_matched = format_loaded_results(
    _free_living_results,
    free_living_index_cols,
    "matched__",
    convert_rel_error=True,
)

del _free_living_results, _free_living_results_raw

# Loading laboratory data
laboratory_index_cols = [
    "cohort",
    "participant_id",
    "time_measure",
    "test",
    "trial",
    "test_name",
    "test_name_pretty",
]

_laboratory_results = {  # Matched and aggregate/combined per-recording results for the laboratory recordings
    v: loader.load_single_results(k, "laboratory")
    for k, v in algorithms.items()
}

_laboratory_results_raw = {  # Matched per-WB results for the laboratory recordings
    v: loader.load_single_csv_file(k, "laboratory", "raw_matched_errors.csv")
    for k, v in algorithms.items()
}
laboratory_results_combined = format_loaded_results(
    _laboratory_results,
    laboratory_index_cols,
    "combined__",
    convert_rel_error=True,
)
laboratory_results_matched = format_loaded_results(
    _laboratory_results,
    laboratory_index_cols,
    "matched__",
    convert_rel_error=True,
)
laboratory_results_matched_raw = format_loaded_results(
    values=_laboratory_results_raw,
    index_cols=laboratory_index_cols,
    col_prefix_filter=None,
    convert_rel_error=True,
)

del _laboratory_results, _laboratory_results_raw
cohort_order = ["HA", "CHF", "COPD", "MS", "PD", "PFF"]
  0%|                                              | 0.00/7.30k [00:00<?, ?B/s]
  0%|                                              | 0.00/7.30k [00:00<?, ?B/s]
100%|█████████████████████████████████████| 7.30k/7.30k [00:00<00:00, 37.8MB/s]

  0%|                                              | 0.00/35.3k [00:00<?, ?B/s]
  0%|                                              | 0.00/35.3k [00:00<?, ?B/s]
100%|██████████████████████████████████████| 35.3k/35.3k [00:00<00:00, 239MB/s]

  0%|                                              | 0.00/36.3k [00:00<?, ?B/s]
  0%|                                              | 0.00/36.3k [00:00<?, ?B/s]
100%|██████████████████████████████████████| 36.3k/36.3k [00:00<00:00, 225MB/s]

  0%|                                               | 0.00/305k [00:00<?, ?B/s]
  0%|                                               | 0.00/305k [00:00<?, ?B/s]
100%|███████████████████████████████████████| 305k/305k [00:00<00:00, 1.79GB/s]

  0%|                                               | 0.00/300k [00:00<?, ?B/s]
  0%|                                               | 0.00/300k [00:00<?, ?B/s]
100%|███████████████████████████████████████| 300k/300k [00:00<00:00, 1.75GB/s]

  0%|                                               | 0.00/197k [00:00<?, ?B/s]
  0%|                                               | 0.00/197k [00:00<?, ?B/s]
100%|███████████████████████████████████████| 197k/197k [00:00<00:00, 1.12GB/s]

  0%|                                               | 0.00/192k [00:00<?, ?B/s]
  0%|                                               | 0.00/192k [00:00<?, ?B/s]
100%|███████████████████████████████████████| 192k/192k [00:00<00:00, 1.15GB/s]

  0%|                                               | 0.00/123k [00:00<?, ?B/s]
  0%|                                               | 0.00/123k [00:00<?, ?B/s]
100%|████████████████████████████████████████| 123k/123k [00:00<00:00, 781MB/s]

  0%|                                               | 0.00/101k [00:00<?, ?B/s]
  0%|                                               | 0.00/101k [00:00<?, ?B/s]
100%|████████████████████████████████████████| 101k/101k [00:00<00:00, 666MB/s]
Performance metrics#
Below you can find the setup for all performance metrics that we will calculate.
We only use the single__ results for the comparison.
These results are calculated by first calculating the average walking speed per walking bout (WB).
Then all WBs of a participant are aggregated. Eventually, the error metrics for each WB are calculated.
Note
For the evaluation of the full pipeline performance, two types of aggregation are performed, which will be described later on in the example.
from functools import partial

from mobgap.pipeline.evaluation import CustomErrorAggregations as A
from mobgap.utils.df_operations import (
    CustomOperation,
    apply_aggregations,
    apply_transformations,
)
from mobgap.utils.tables import FormatTransformer as F
from mobgap.utils.tables import RevalidationInfo, revalidation_table_styles

custom_aggs_combined = [
    CustomOperation(
        identifier=None,
        function=A.n_datapoints,
        column_name=[("n_datapoints", "all")],
    ),
    ("walking_speed_mps__detected", ["mean", A.conf_intervals]),
    ("walking_speed_mps__reference", ["mean", A.conf_intervals]),
    ("walking_speed_mps__error", ["mean", A.loa]),
    ("walking_speed_mps__abs_error", ["mean", A.conf_intervals]),
    ("walking_speed_mps__rel_error", ["mean", A.conf_intervals]),
    ("walking_speed_mps__abs_rel_error", ["mean", A.conf_intervals]),
    CustomOperation(
        identifier=None,
        function=partial(
            A.icc,
            reference_col_name="walking_speed_mps__reference",
            detected_col_name="walking_speed_mps__detected",
            icc_type="icc2",
            # For the lab data, some trials have no results for the old algorithms.
            nan_policy="omit",
        ),
        column_name=[("icc", "all"), ("icc_ci", "all")],
    ),
]

custom_aggs_matched = [
    CustomOperation(
        identifier=None,
        function=lambda df_: df_["n_matched_wbs"].sum(),
        column_name=[("n_wbs_matched", "all")],
    ),
    *custom_aggs_combined,
]

format_transforms_combined = [
    CustomOperation(
        identifier=None,
        function=lambda df_: df_[("n_datapoints", "all")].astype(int),
        column_name="n_datapoints",
    ),
    *(
        CustomOperation(
            identifier=None,
            function=partial(
                F.value_with_metadata,
                value_col=("mean", c),
                other_columns={"range": ("conf_intervals", c)},
            ),
            column_name=c,
        )
        for c in [
            "walking_speed_mps__reference",
            "walking_speed_mps__detected",
            "walking_speed_mps__abs_error",
            "walking_speed_mps__rel_error",
            "walking_speed_mps__abs_rel_error",
        ]
    ),
    CustomOperation(
        identifier=None,
        function=partial(
            F.value_with_metadata,
            value_col=("mean", "walking_speed_mps__error"),
            other_columns={"range": ("loa", "walking_speed_mps__error")},
        ),
        column_name="walking_speed_mps__error",
    ),
    CustomOperation(
        identifier=None,
        function=partial(
            F.value_with_metadata,
            value_col=("icc", "all"),
            other_columns={"range": ("icc_ci", "all")},
        ),
        column_name="icc",
    ),
]

format_transforms_matched = [
    CustomOperation(
        identifier=None,
        function=lambda df_: df_[("n_wbs_matched", "all")].astype(int),
        column_name="n_wbs_matched",
    ),
    *format_transforms_combined,
]


final_names_combined = {
    "n_datapoints": "# participants",
    "walking_speed_mps__detected": "WD mean and CI [m/s]",
    "walking_speed_mps__reference": "INDIP mean and CI [m/s]",
    "walking_speed_mps__error": "Bias and LoA [m/s]",
    "walking_speed_mps__abs_error": "Abs. Error [m/s]",
    "walking_speed_mps__rel_error": "Rel. Error [%]",
    "walking_speed_mps__abs_rel_error": "Abs. Rel. Error [%]",
    "icc": "ICC",
}

final_names_matched = {
    **final_names_combined,
    "n_wbs_matched": "# Matched WBs",
}

validation_thresholds = {
    "Abs. Error [m/s]": RevalidationInfo(
        threshold=None, higher_is_better=False
    ),
    "Abs. Rel. Error [%]": RevalidationInfo(
        threshold=20, higher_is_better=False
    ),
    "ICC": RevalidationInfo(threshold=0.7, higher_is_better=True),
}


def format_tables_combined(df: pd.DataFrame) -> pd.DataFrame:
    return (
        df.pipe(apply_transformations, format_transforms_combined)
        .rename(columns=final_names_combined)
        .loc[:, list(final_names_combined.values())]
    )


def format_tables_matched(df: pd.DataFrame) -> pd.DataFrame:
    return (
        df.pipe(apply_transformations, format_transforms_matched)
        .rename(columns=final_names_matched)
        .loc[:, list(final_names_matched.values())]
    )
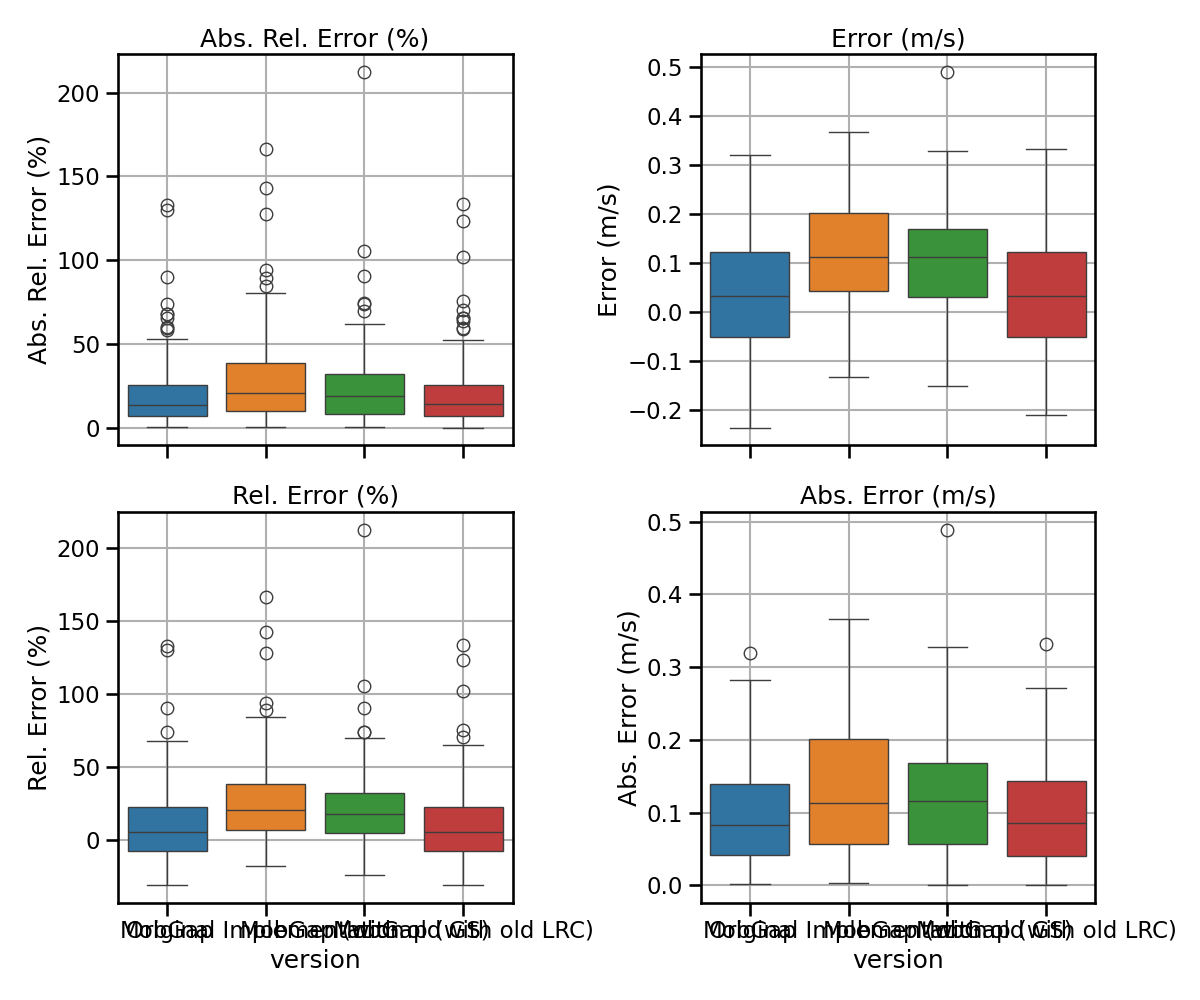
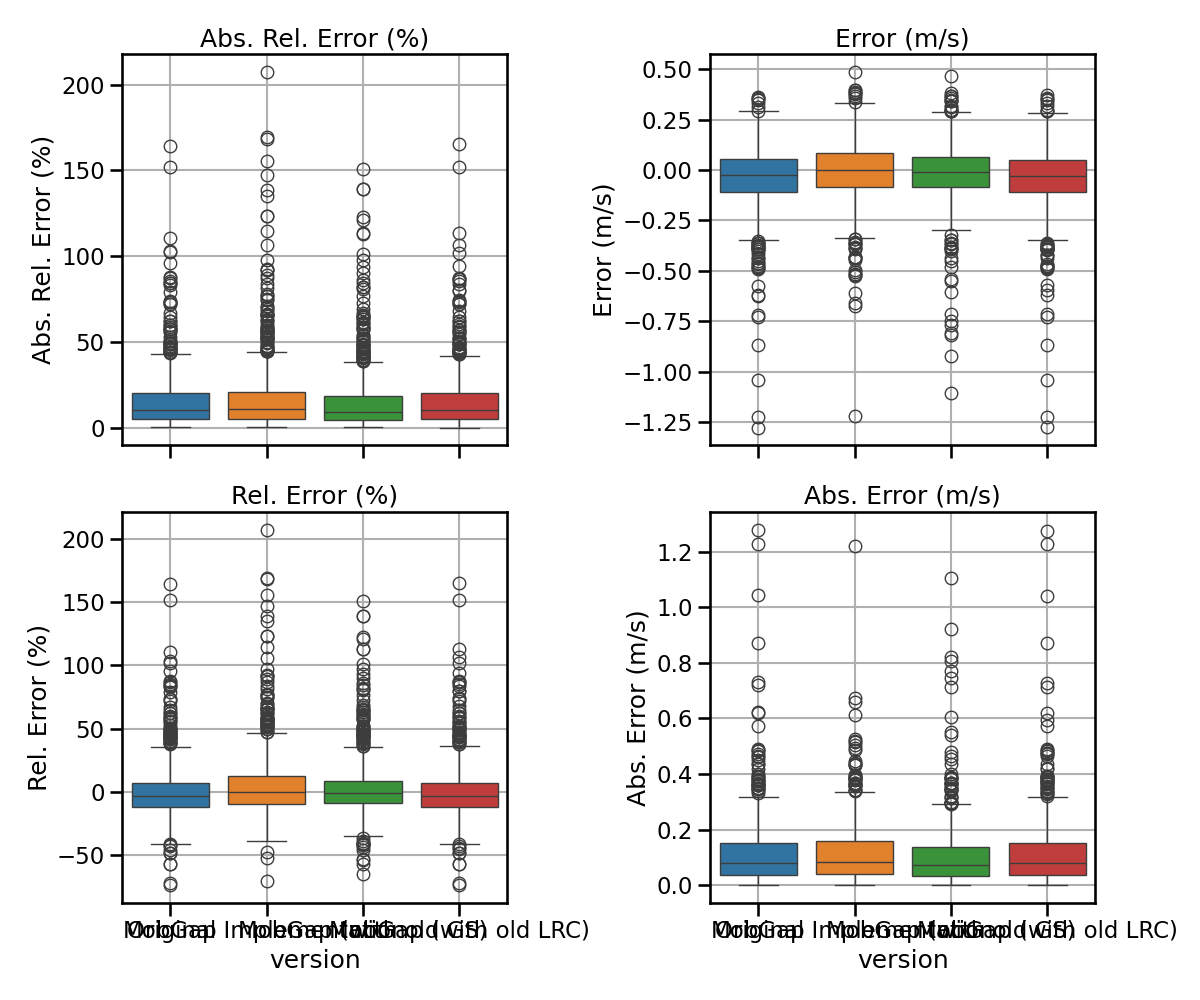
Free-living dataset#
Combined/Aggregated Evaluation#
Below a quick compressed version of the results without further explanation. For information on the metrics, see the main full pipeline analysis example.
All results across all cohorts#
import matplotlib.pyplot as plt
import seaborn as sns

sns.set_context("talk")
metrics = {
    "abs_rel_error": "Abs. Rel. Error (%)",
    "error": "Error (m/s)",
    "rel_error": "Rel. Error (%)",
    "abs_error": "Abs. Error (m/s)",
}


def multi_metric_plot(data, metrics, nrows, ncols):
    fig, axs = plt.subplots(
        nrows, ncols, sharex=True, figsize=(ncols * 6, nrows * 4 + 2)
    )
    for ax, (metric, metric_label) in zip(axs.flatten(), metrics.items()):
        overall_df = data[["version", f"walking_speed_mps__{metric}"]].rename(
            columns={f"walking_speed_mps__{metric}": metric_label}
        )

        sns.boxplot(
            data=overall_df, x="version", hue="version", y=metric_label, ax=ax
        )

        ax.set_title(metric_label)
        ax.set_ylabel(metric_label)

        ax.tick_params(axis="both", which="major")
        ax.tick_params(axis="both", which="minor")

        ax.grid(True)

    plt.tight_layout()
    plt.show()


free_living_results_combined.pipe(multi_metric_plot, metrics, 2, 2)
free_living_combined_perf_metrics_all = (
    free_living_results_combined.groupby(["algo", "version"])
    .apply(apply_aggregations, custom_aggs_combined, include_groups=False)
    .pipe(format_tables_combined)
)
free_living_combined_perf_metrics_all.style.pipe(
    revalidation_table_styles, validation_thresholds, ["algo"]
)
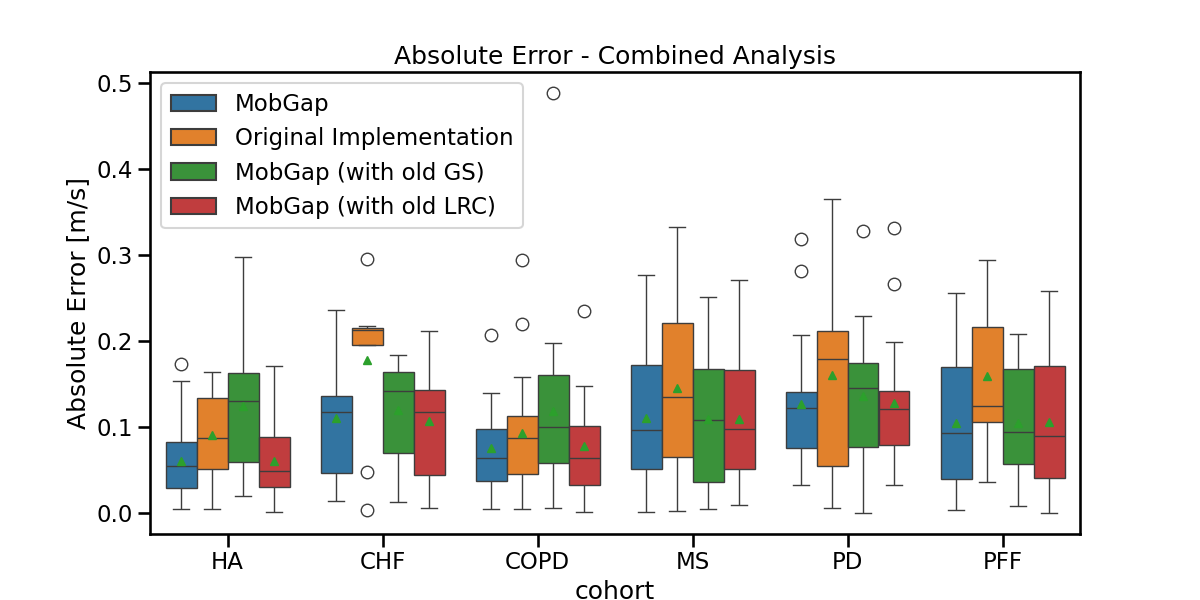
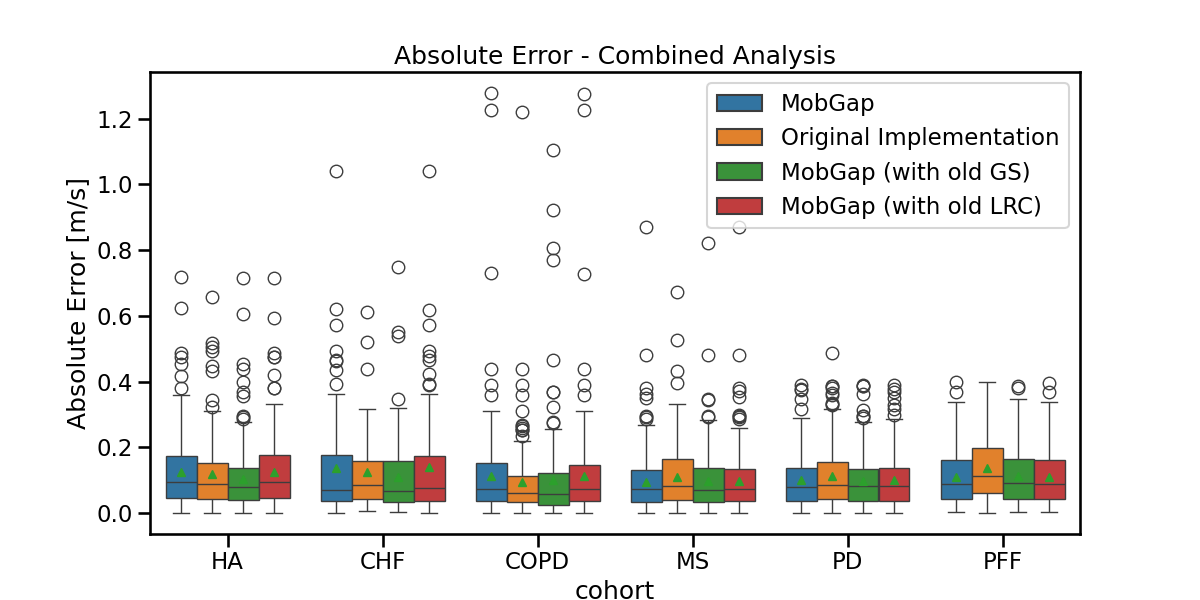
Per-cohort analysis#
fig, ax = plt.subplots(figsize=(12, 6))
sns.boxplot(
    data=free_living_results_combined,
    x="cohort",
    y="walking_speed_mps__abs_error",
    hue="version",
    order=cohort_order,
    showmeans=True,
    ax=ax,
).legend().set_title(None)
ax.set_ylabel("Absolute Error [m/s]")
ax.set_title("Absolute Error - Combined Analysis")
fig.show()
free_living_combined_perf_metrics_cohort = (
    free_living_results_combined.groupby(["cohort", "algo", "version"])
    .apply(apply_aggregations, custom_aggs_combined, include_groups=False)
    .pipe(format_tables_combined)
    .loc[cohort_order]
)
free_living_combined_perf_metrics_cohort.style.pipe(
    revalidation_table_styles, validation_thresholds, ["cohort", "algo"]
)
Matched/True Positive Evaluation#
free_living_results_matched.pipe(multi_metric_plot, metrics, 2, 2)
free_living_matched_perf_metrics_all = (
    free_living_results_matched.groupby(["algo", "version"])
    .apply(apply_aggregations, custom_aggs_matched, include_groups=False)
    .pipe(format_tables_matched)
)

free_living_matched_perf_metrics_all.style.pipe(
    revalidation_table_styles, validation_thresholds, ["algo"]
)
fig, ax = plt.subplots(figsize=(12, 6))
sns.barplot(
    data=free_living_results_matched.groupby(["version", "cohort"])[
        "n_matched_wbs"
    ]
    .sum()
    .reset_index(),
    hue="version",
    y="n_matched_wbs",
    x="cohort",
    order=cohort_order,
    hue_order=["new", "old", "new with old GS", "new with old LRC"],
    ax=ax,
)
fig.show()

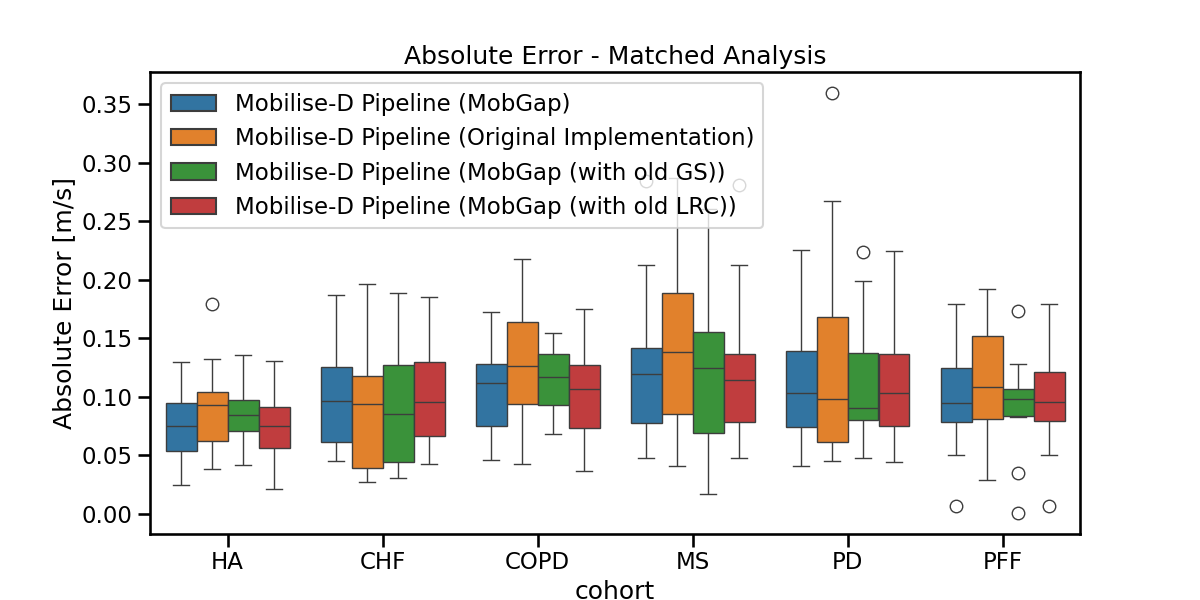
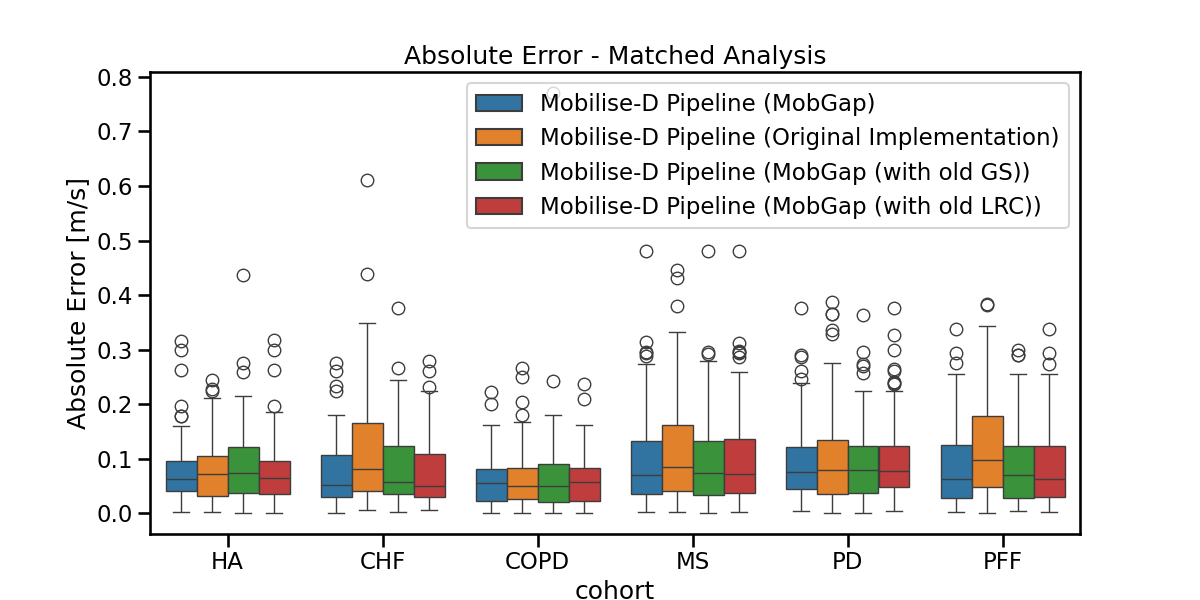
fig, ax = plt.subplots(figsize=(12, 6))
sns.boxplot(
    data=free_living_results_matched,
    x="cohort",
    y="walking_speed_mps__abs_error",
    hue="algo_with_version",
    order=cohort_order,
    ax=ax,
).legend().set_title(None)
ax.set_ylabel("Absolute Error [m/s]")
ax.set_title("Absolute Error - Matched Analysis")
fig.show()
free_living_matched_perf_metrics_cohort = (
    free_living_results_matched.groupby(["cohort", "algo", "version"])
    .apply(apply_aggregations, custom_aggs_matched, include_groups=False)
    .pipe(format_tables_matched)
    .loc[cohort_order]
)
free_living_matched_perf_metrics_cohort.style.pipe(
    revalidation_table_styles, validation_thresholds, ["cohort", "algo"]
)
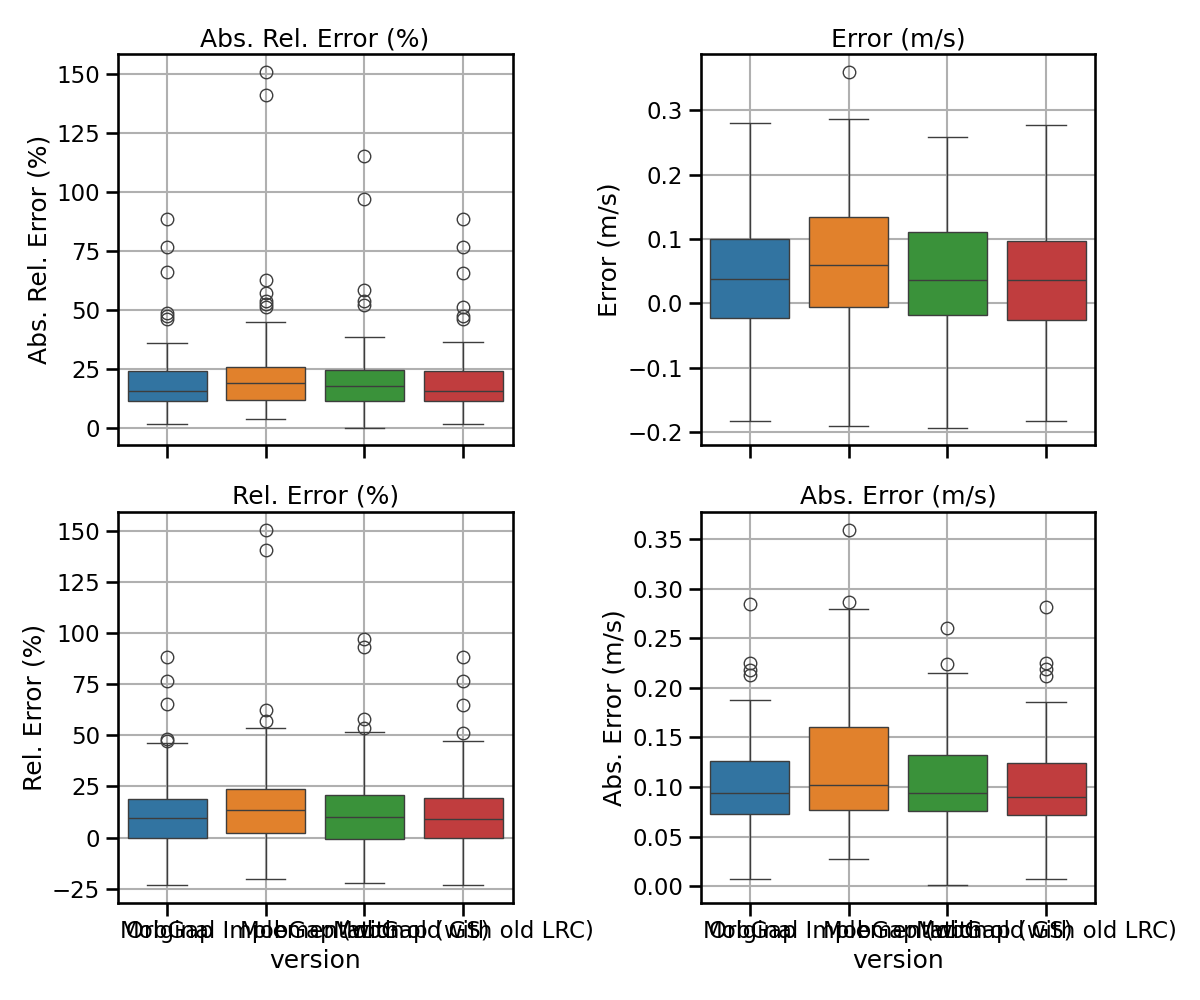
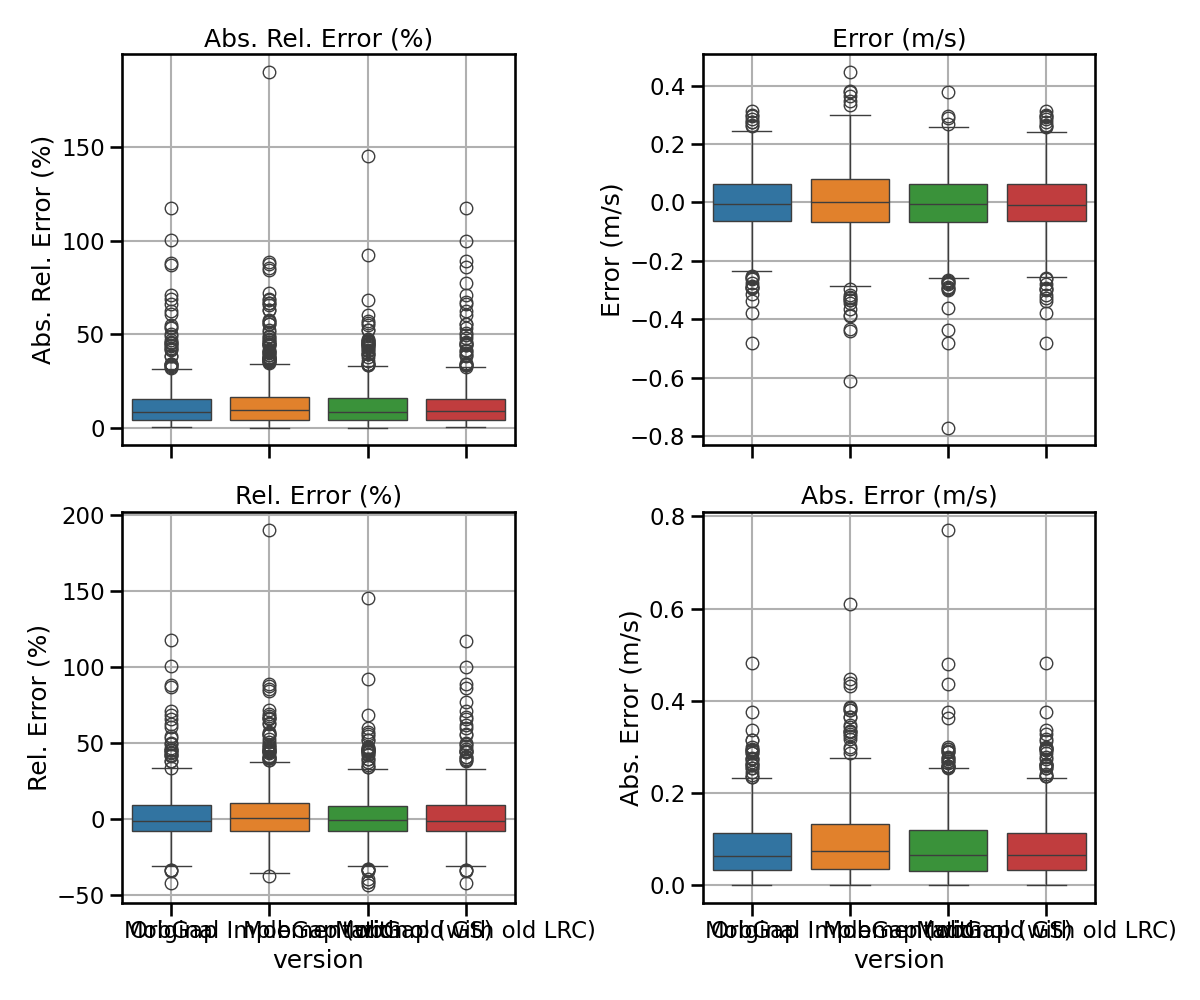
Laboratory dataset#
Combined/Aggregated Evaluation#
Below a quick compressed version of the results without further explanation. For information on the metrics, see the main full pipeline analysis example.
All results across all cohorts#
import matplotlib.pyplot as plt
import seaborn as sns

sns.set_context("talk")
metrics = {
    "abs_rel_error": "Abs. Rel. Error (%)",
    "error": "Error (m/s)",
    "rel_error": "Rel. Error (%)",
    "abs_error": "Abs. Error (m/s)",
}


def multi_metric_plot(data, metrics, nrows, ncols):
    fig, axs = plt.subplots(
        nrows, ncols, sharex=True, figsize=(ncols * 6, nrows * 4 + 2)
    )
    for ax, (metric, metric_label) in zip(axs.flatten(), metrics.items()):
        overall_df = data[["version", f"walking_speed_mps__{metric}"]].rename(
            columns={f"walking_speed_mps__{metric}": metric_label}
        )

        sns.boxplot(
            data=overall_df, x="version", hue="version", y=metric_label, ax=ax
        )

        ax.set_title(metric_label)
        ax.set_ylabel(metric_label)

        ax.tick_params(axis="both", which="major")
        ax.tick_params(axis="both", which="minor")

        ax.grid(True)

    plt.tight_layout()
    plt.show()


laboratory_results_combined.pipe(multi_metric_plot, metrics, 2, 2)
laboratory_combined_perf_metrics_all = (
    laboratory_results_combined.groupby(["algo", "version"])
    .apply(apply_aggregations, custom_aggs_combined, include_groups=False)
    .pipe(format_tables_combined)
)
laboratory_combined_perf_metrics_all.style.pipe(
    revalidation_table_styles, validation_thresholds, ["algo"]
)
Per-cohort analysis#
fig, ax = plt.subplots(figsize=(12, 6))
sns.boxplot(
    data=laboratory_results_combined,
    x="cohort",
    y="walking_speed_mps__abs_error",
    hue="version",
    order=cohort_order,
    showmeans=True,
    ax=ax,
).legend().set_title(None)
ax.set_ylabel("Absolute Error [m/s]")
ax.set_title("Absolute Error - Combined Analysis")
fig.show()
laboratory_combined_perf_metrics_cohort = (
    laboratory_results_combined.groupby(["cohort", "algo", "version"])
    .apply(apply_aggregations, custom_aggs_combined, include_groups=False)
    .pipe(format_tables_combined)
    .loc[cohort_order]
)
laboratory_combined_perf_metrics_cohort.style.pipe(
    revalidation_table_styles, validation_thresholds, ["cohort", "algo"]
)
Matched/True Positive Evaluation#
laboratory_results_matched.pipe(multi_metric_plot, metrics, 2, 2)
laboratory_matched_perf_metrics_all = (
    laboratory_results_matched.groupby(["algo", "version"])
    .apply(apply_aggregations, custom_aggs_matched, include_groups=False)
    .pipe(format_tables_matched)
)

laboratory_matched_perf_metrics_all.style.pipe(
    revalidation_table_styles, validation_thresholds, ["algo"]
)
fig, ax = plt.subplots(figsize=(12, 6))
sns.barplot(
    data=laboratory_results_matched.groupby(["version", "cohort"])[
        "n_matched_wbs"
    ]
    .sum()
    .reset_index(),
    hue="version",
    y="n_matched_wbs",
    x="cohort",
    order=cohort_order,
    hue_order=["new", "old", "new with old GS", "new with old LRC"],
    ax=ax,
)
fig.show()
fig, ax = plt.subplots(figsize=(12, 6))
sns.boxplot(
    data=laboratory_results_matched,
    x="cohort",
    y="walking_speed_mps__abs_error",
    hue="algo_with_version",
    order=cohort_order,
    ax=ax,
).legend().set_title(None)
ax.set_ylabel("Absolute Error [m/s]")
ax.set_title("Absolute Error - Matched Analysis")
fig.show()
laboratory_matched_perf_metrics_cohort = (
    laboratory_results_matched.groupby(["cohort", "algo", "version"])
    .apply(apply_aggregations, custom_aggs_matched, include_groups=False)
    .pipe(format_tables_matched)
    .loc[cohort_order]
)
laboratory_matched_perf_metrics_cohort.style.pipe(
    revalidation_table_styles, validation_thresholds, ["cohort", "algo"]
)
Total running time of the script: (0 minutes 17.260 seconds)
Estimated memory usage: 80 MB